
Chart analytics on Loca-Nation means three things together: where a track sits on the chart, how listeners vote and play it, and the engagement signals showing whether people actually come back. The metrics to check first are save rate, repeat plays per listener, and profile visits or votes. These three tell you more about a track’s real staying power than raw play counts ever will.
Start here today: pull up your most recent release, note its save rate, and set a target for where you want that number in 30 days.
-
Save rate: the percentage of listeners who save a track after playing it
-
Repeat plays: how many times the same listener comes back to a track
-
Profile visits / votes: whether a play converts into a chart vote or a visit to your artist profile
Key Takeaways
Chart analytics on Loca-Nation works because engagement signals like saves and repeat plays predict long-term chart progress far better than raw play counts do.
| Point | Details |
|---|---|
| Check three metrics first | Save rate, repeat plays per listener, and profile visits or votes matter more than raw plays. |
| Know your save-rate range | Above roughly 7% tends to compound reach; below about 4.5% rarely gets algorithmic lift. |
| Separate momentum from stage | Short-term slope shows a spike; long-term median shows your real trajectory. |
| Test one variable per cycle | Change one creative element or one distribution channel, then measure after 14 days. |
| Use Loca-Nation’s dashboard | Chart history, votes timeline, and engagement breakdown live in your artist profile for tracking every metric above. |
Table of Contents
What the core chart metrics actually mean
Chart position is relative, not absolute. Your play count can climb week over week and your position can still slip if other artists in your genre or region are climbing faster. Read position alongside your own raw numbers, never instead of them.
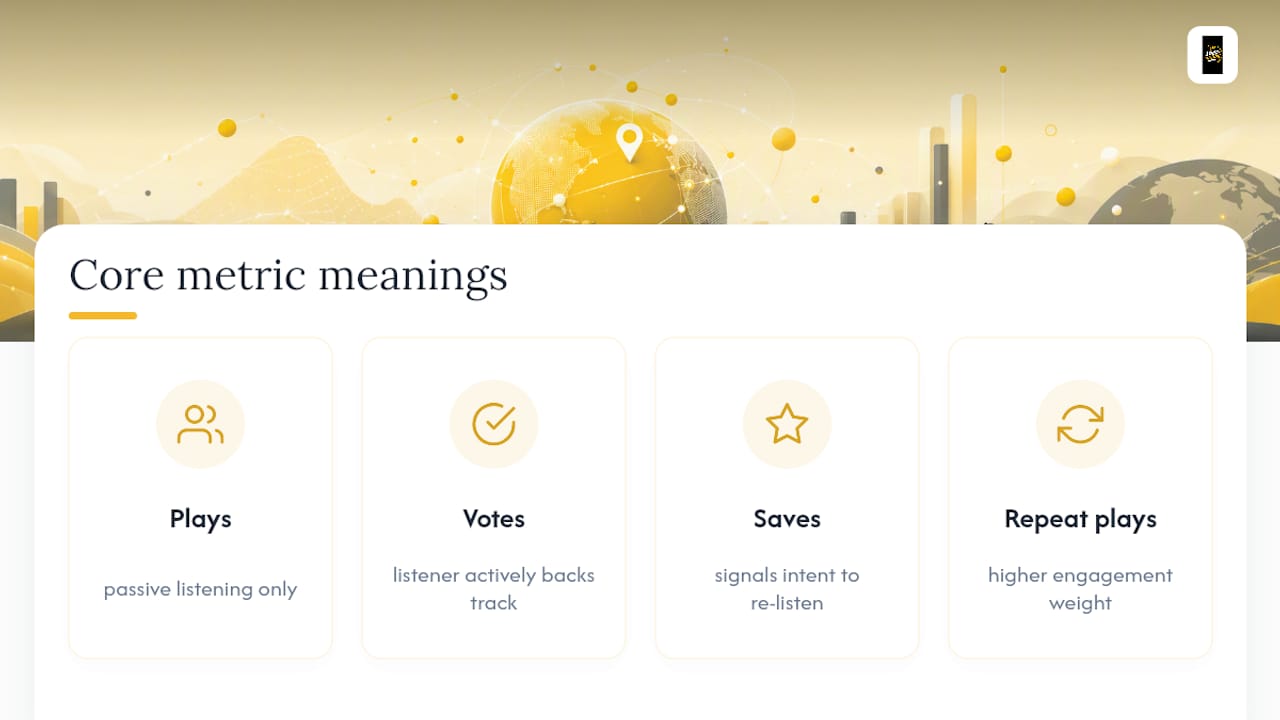
Votes and plays measure different things. A play just means someone heard the track. A vote is a listener actively choosing to back it, and that distinction matters for how Loca-nation weighs engagement over passive listening. Saves and repeat plays get weighted more heavily than a single play because they signal a listener intends to hear the track again, which is the behavior that predicts long-term growth rather than a one-day bump.
This is also where momentum and career stage diverge. Momentum is your short-term slope, the direction your numbers are trending over the last couple of weeks. Career stage is closer to a long-term median, smoothing out noise so you can see your actual trajectory. Chartmetric’s scoring model treats these as distinct signals, and it’s a useful mental model even outside their platform. A single viral spike raises momentum without moving your career-stage baseline at all.

Tracks with save rates above a certain threshold tend to compound in algorithmic reach, while those below a lower threshold rarely get that extra lift, according to music marketing funnel research. Genre and career stage shift these numbers, but they’re a solid starting reference.
Pro Tip: A one-day spike in plays with no matching bump in saves usually means a bot-driven playlist or a single large but disengaged audience found the track, not new fans. Check saves before you celebrate the spike.
How do you read the Loca-Nation dashboard?
Your dashboard has four panels worth checking in order: chart history, votes timeline, engagement breakdown (saves and repeats), and audience location or affinity. Chart history shows your trajectory, not just your current spot. The votes timeline separates genuine listener action from passive plays. Engagement breakdown is where save rate and repeat plays live. Audience data tells you where your real fans are clustering geographically or by genre.
Here’s a simple first-30-day routine after a release:
-
Day 1 to 3: Watch for early plays and note your starting save rate. Don’t judge anything yet.
-
Week 1: Compare save rate against your last release. Check the vote-to-listener ratio, meaning how many unique listeners actually cast a vote versus just streamed once.
-
Weeks 2 to 4: Track where new listeners are coming from. A track picking up steam from three or four different sources is healthier than one riding a single playlist.
Watch for red flags: a big one-day spike with zero corresponding saves, repeat plays that stay flat past week one, or nearly all your streams coming from one playlist that later goes inactive.
Pro Tip: If more than 80% of your plays trace back to a single playlist, treat your numbers as fragile until a second source shows up. One playlist going dark can erase your momentum overnight.
What tactics actually grow chart engagement?
Not every tactic moves the same metric, so match your effort to the number you’re trying to shift.
To raise saves:
- Strengthen your intro. Listeners decide whether to save a track in the first 10 seconds.
To build community and repeat plays:
-
Run a small "save" drive through email or your closest fan group rather than a broad public push.
-
Host a small listening event for your most engaged fans before general release.
-
Prioritize direct-to-fan channels; a small cohort of super listeners tends to generate a disproportionate share of long-term plays and support.
To improve placement quality:
- Keep a steady release cadence with several weeks between quality drops, paired with multiple short-form clips per track, to keep your engagement window active and support consistent growth source.
A simple test for your next release cycle: try two different intro edits and one new distribution channel (a micro-curator playlist, for example), then measure the save-rate change after 14 days. Keep whatever wins and drop the rest.
Pro Tip: Test one variable at a time. Changing your cover art, your intro, and your release day all at once tells you nothing about which change actually moved the needle.
Setting weekly and monthly KPI targets
A short, repeatable review rhythm beats obsessive daily checking. Five KPIs cover almost everything that matters: save rate, repeat plays per listener, profile visits, playlist adds, and votes per unique listener.
-
Developing artists: aim for save rates moving toward a range associated with algorithmic reach growth, with any consistent week-over-week repeat-play growth counted as positive.
-
Mid-level artists: aim for save rates that support strong algorithmic carry and track playlist adds as indicators of engagement quality rather than just total streams, as these metrics better predict algorithmic impact source.
Check numbers weekly for quick directional reads, but save real decisions for a monthly review: double down on whatever channel produced your best save-to-listener ratio, tweak creative elements that underperformed, or drop a distribution tactic that never converted.
Where to find these tools on Loca-Nation
Your chart history, votes timeline, and engagement breakdown all live inside your Loca-Nation artist profile, updated as your track moves through the chart cycle. Genre onboarding places your release into the right chart and discovery bucket from the start, which matters because a track competing in the wrong genre bucket skews every benchmark above.
-
Chart history and votes timeline: your artist dashboard
-
Engagement breakdown (saves, repeats): dashboard analytics panel
-
Sync opportunities: sync catalogue submissions
-
Editorial exposure: press centre resources
Loca-Nation was built on the idea that talent and genuine listener engagement should decide who rises, not who spent the most on promotion. The analytics exist so artists can prove that engagement with real numbers.
An experiment worth running this release
Pick one metric. I’d start with vote rate and save rate secondly. Aim to lift it by also posting on social media without only relying on the listener engagement we already have on the platform. A single high-play week means little if the same listeners never come back. The funnel from stranger to fan runs through votes, saves and repeat plays, not raw reach, and that’s the number that still matters six months from now.
Put this into practice on Loca-Nation
Loca-Nation gives you the chart itself, plus every analytics panel this guide walks through , without charging listeners a cent or requiring industry connections to get noticed. That’s the real difference from chasing playlist placements elsewhere and hoping the numbers add up: here, save rate, repeat plays, and votes are visible on your own dashboard the moment they happen, tied directly to a chart built around genuine engagement rather than spend.
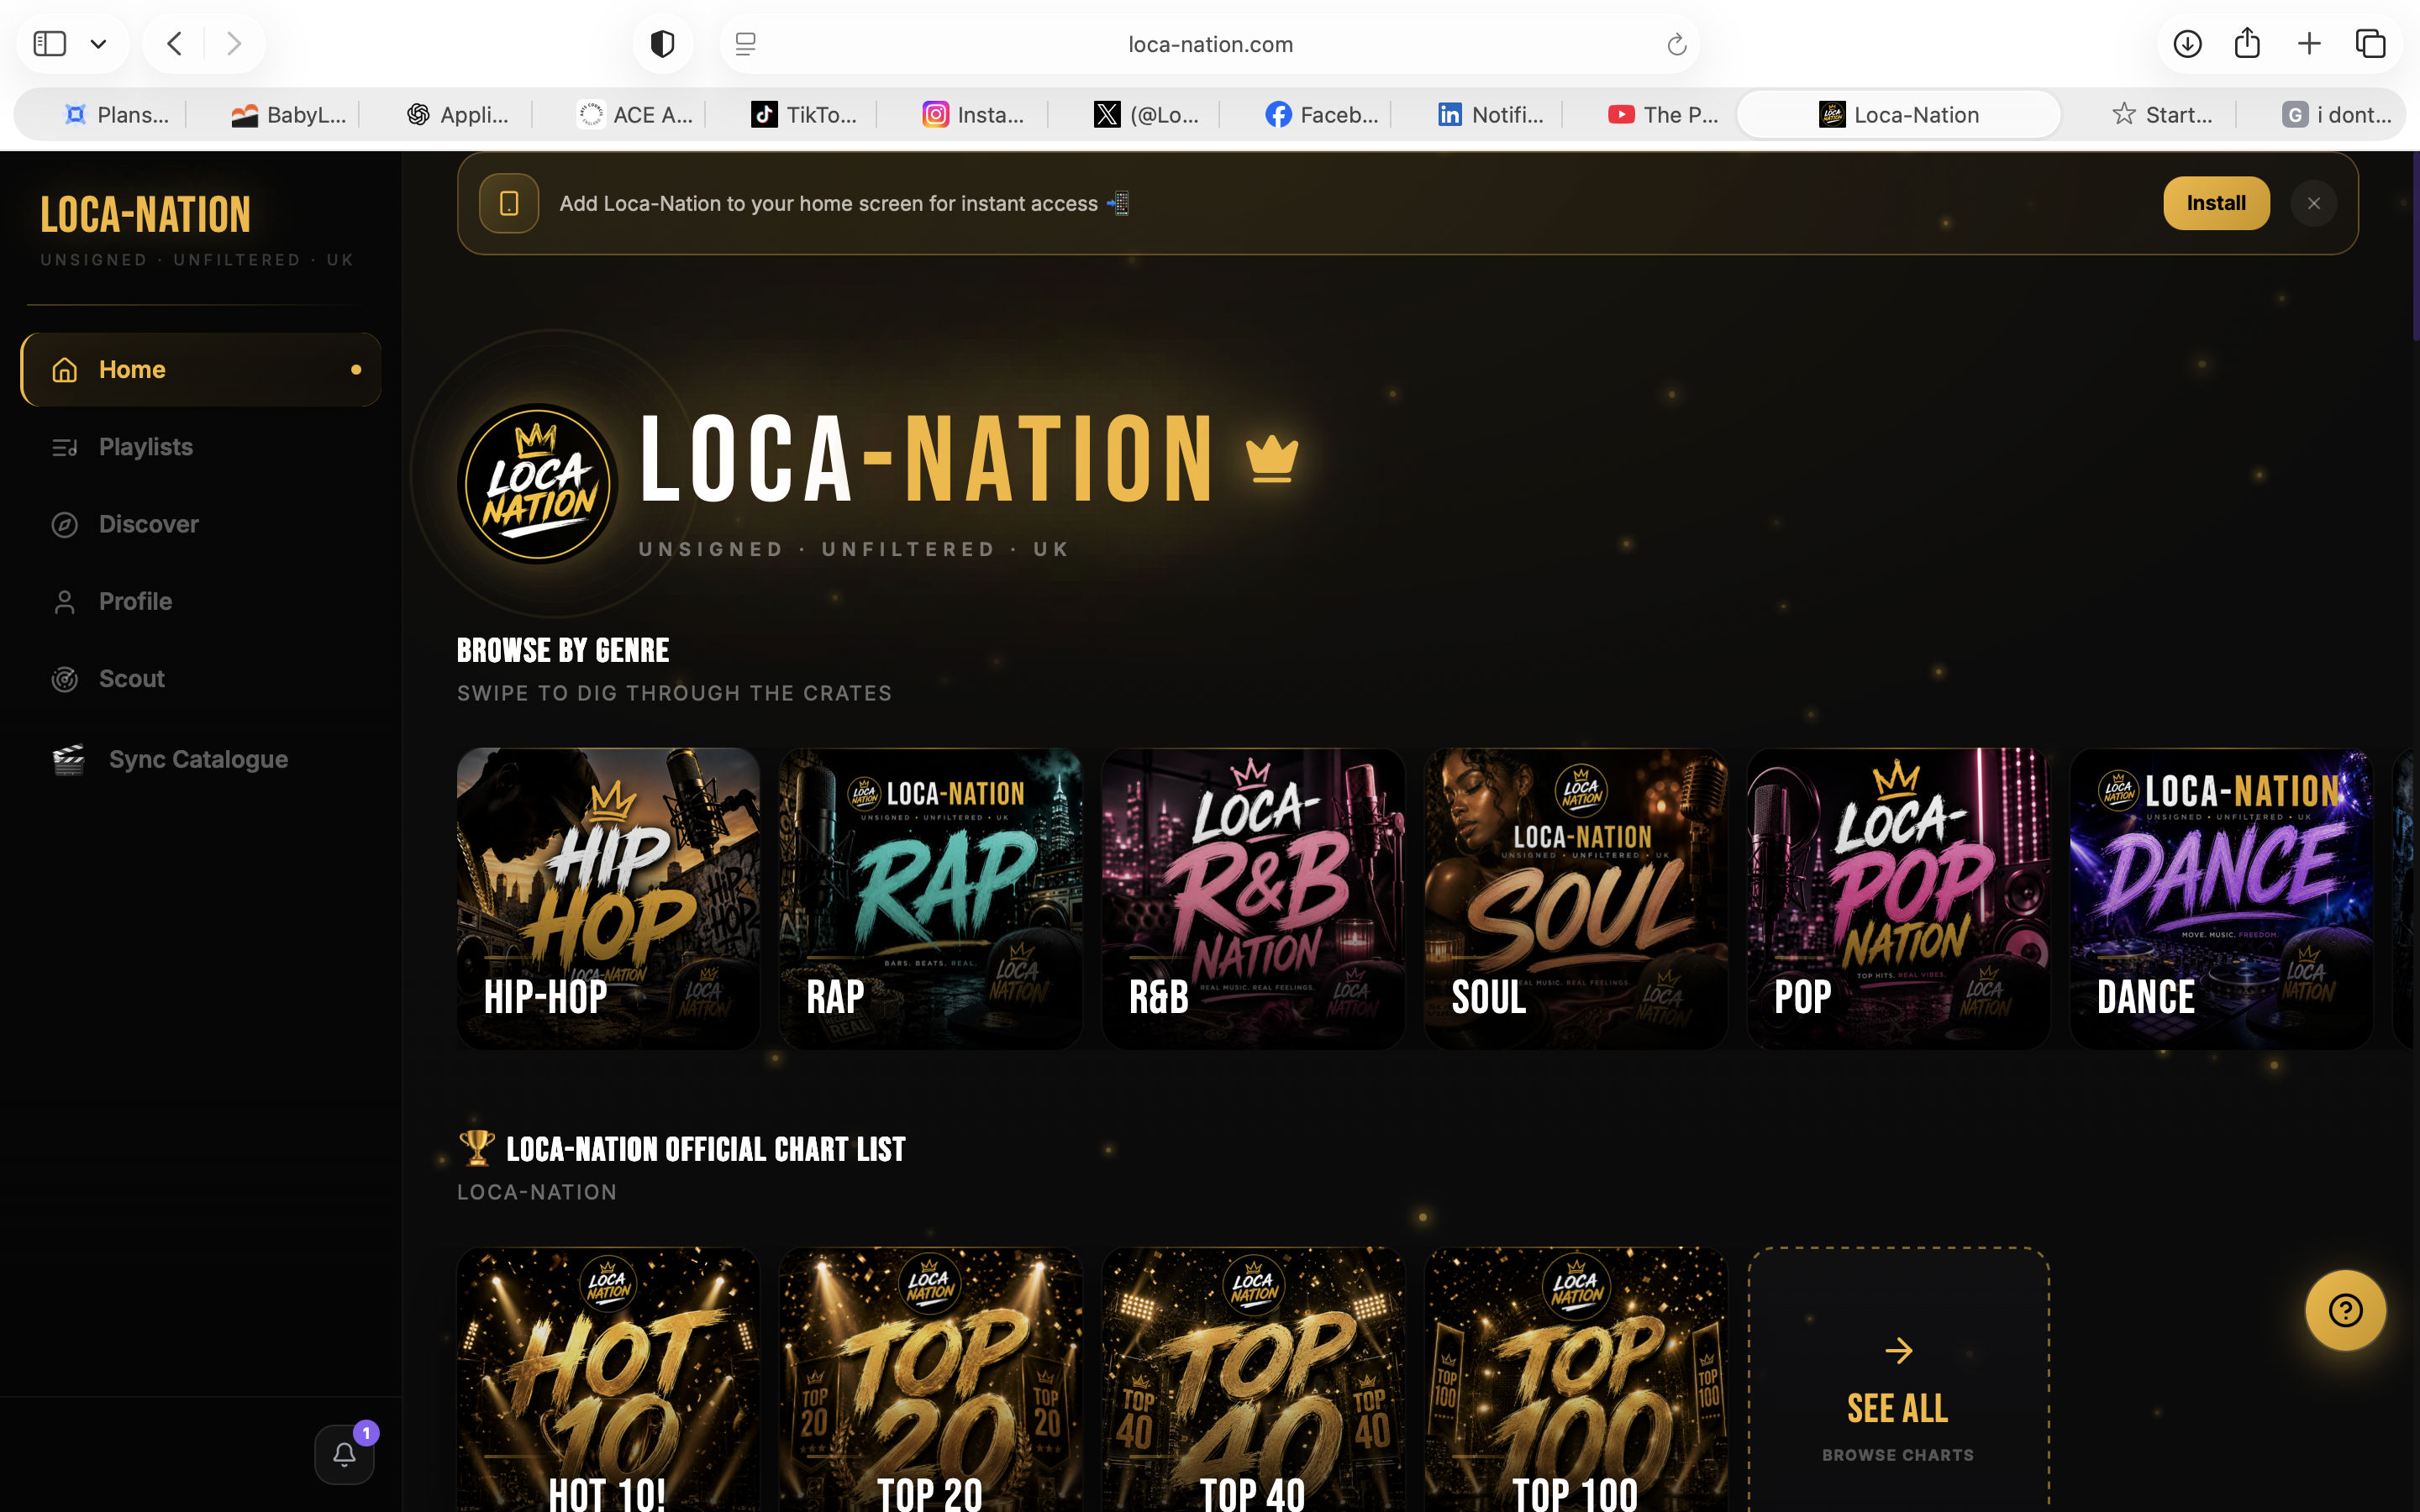
Once your genre onboarding is set through genre onboarding, your release competes in the right bucket from day one, which keeps every benchmark in this guide accurate for your actual audience. If sync revenue fits your goals, the sync catalogue is worth a submission once a track shows a healthy save rate. Upload your next release, watch your first-week numbers land in your dashboard, and run the save-rate experiment above starting now.
Please note advanced analytics are available through a premium subscription at £4.99
Sources
-
Music Marketing Funnel (How Independent Artists Turn Strangers Into Superfans)
-
A stream is not a fan: What independent artists should measure instead